Representing data
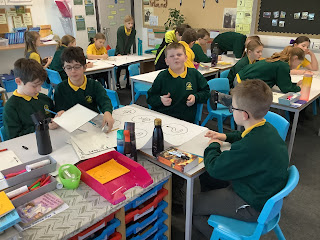
Today, the children chose how to represent their data from their fieldwork trip. Using Google Slides, they learnt how to input their data and then insert it into a chart of their choice. Some chose pie charts, others line graphs or bar charts.
Then they had to discuss their findings to a partner and write a short sentence explaining what they found out. Some reflected on their choice of question and how they would change it next time.
Great effort to you all.


Comments
Post a Comment